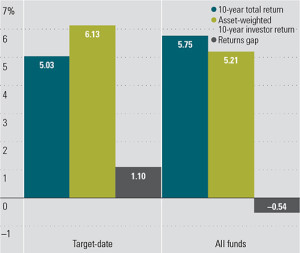
Bar graph showing ten-year total return, asset-weighted ten-year investor return, and returns gap.
Recent Articles
- A Good Time in Asset Management
- Underperforming Value Stocks
- Are Today’s High Stock Prices Masking an Economy in Remission?
- Could the Stock Market Crash of 1929 Repeat Itself?
- Judging the Global Economy By Swiss Watch Time
- What’s Driving the Feds Ramping Up More Liquidity Injections?
- Stock BuyBacks Slow As Market Reflects Possible Recession
- Insider Trading; Do The Dots Connect?
- Why Earnings For Some Are Better (or Worse) than Expected
- Is China Gaining the Upper Hand in Trade War?
- Tracking Possible Recession Via Home Prices
- How Would Jesus Invest?
- Lagging Consumer Confidence Slows Economy
- Are US Farmers Guaranteed Billions More in 2020 Aid?
- Congress Fights Trump Plan to Make Fanny Mae and Freddy Mac Private

